This summer, I proposed a research project for PROMYS (the PROgram in Mathematics for Young Scientists), a six-week intensive summer program at Boston University where highly motivated high school students explore mathematics. Three students (Nir Elber, Raymond Feng, and Henry Xie) chose to work on this project, and previous PROMYSer Anupam Datta gave additional guidance. Their summary of their findings can be found here. (UPDATE: a version of this now appears on the arXiv too).
Here I briefly describe the project and the work of Nir, Raymond, and Henry.
The project was organized around understanding why the following picture has so much structure.
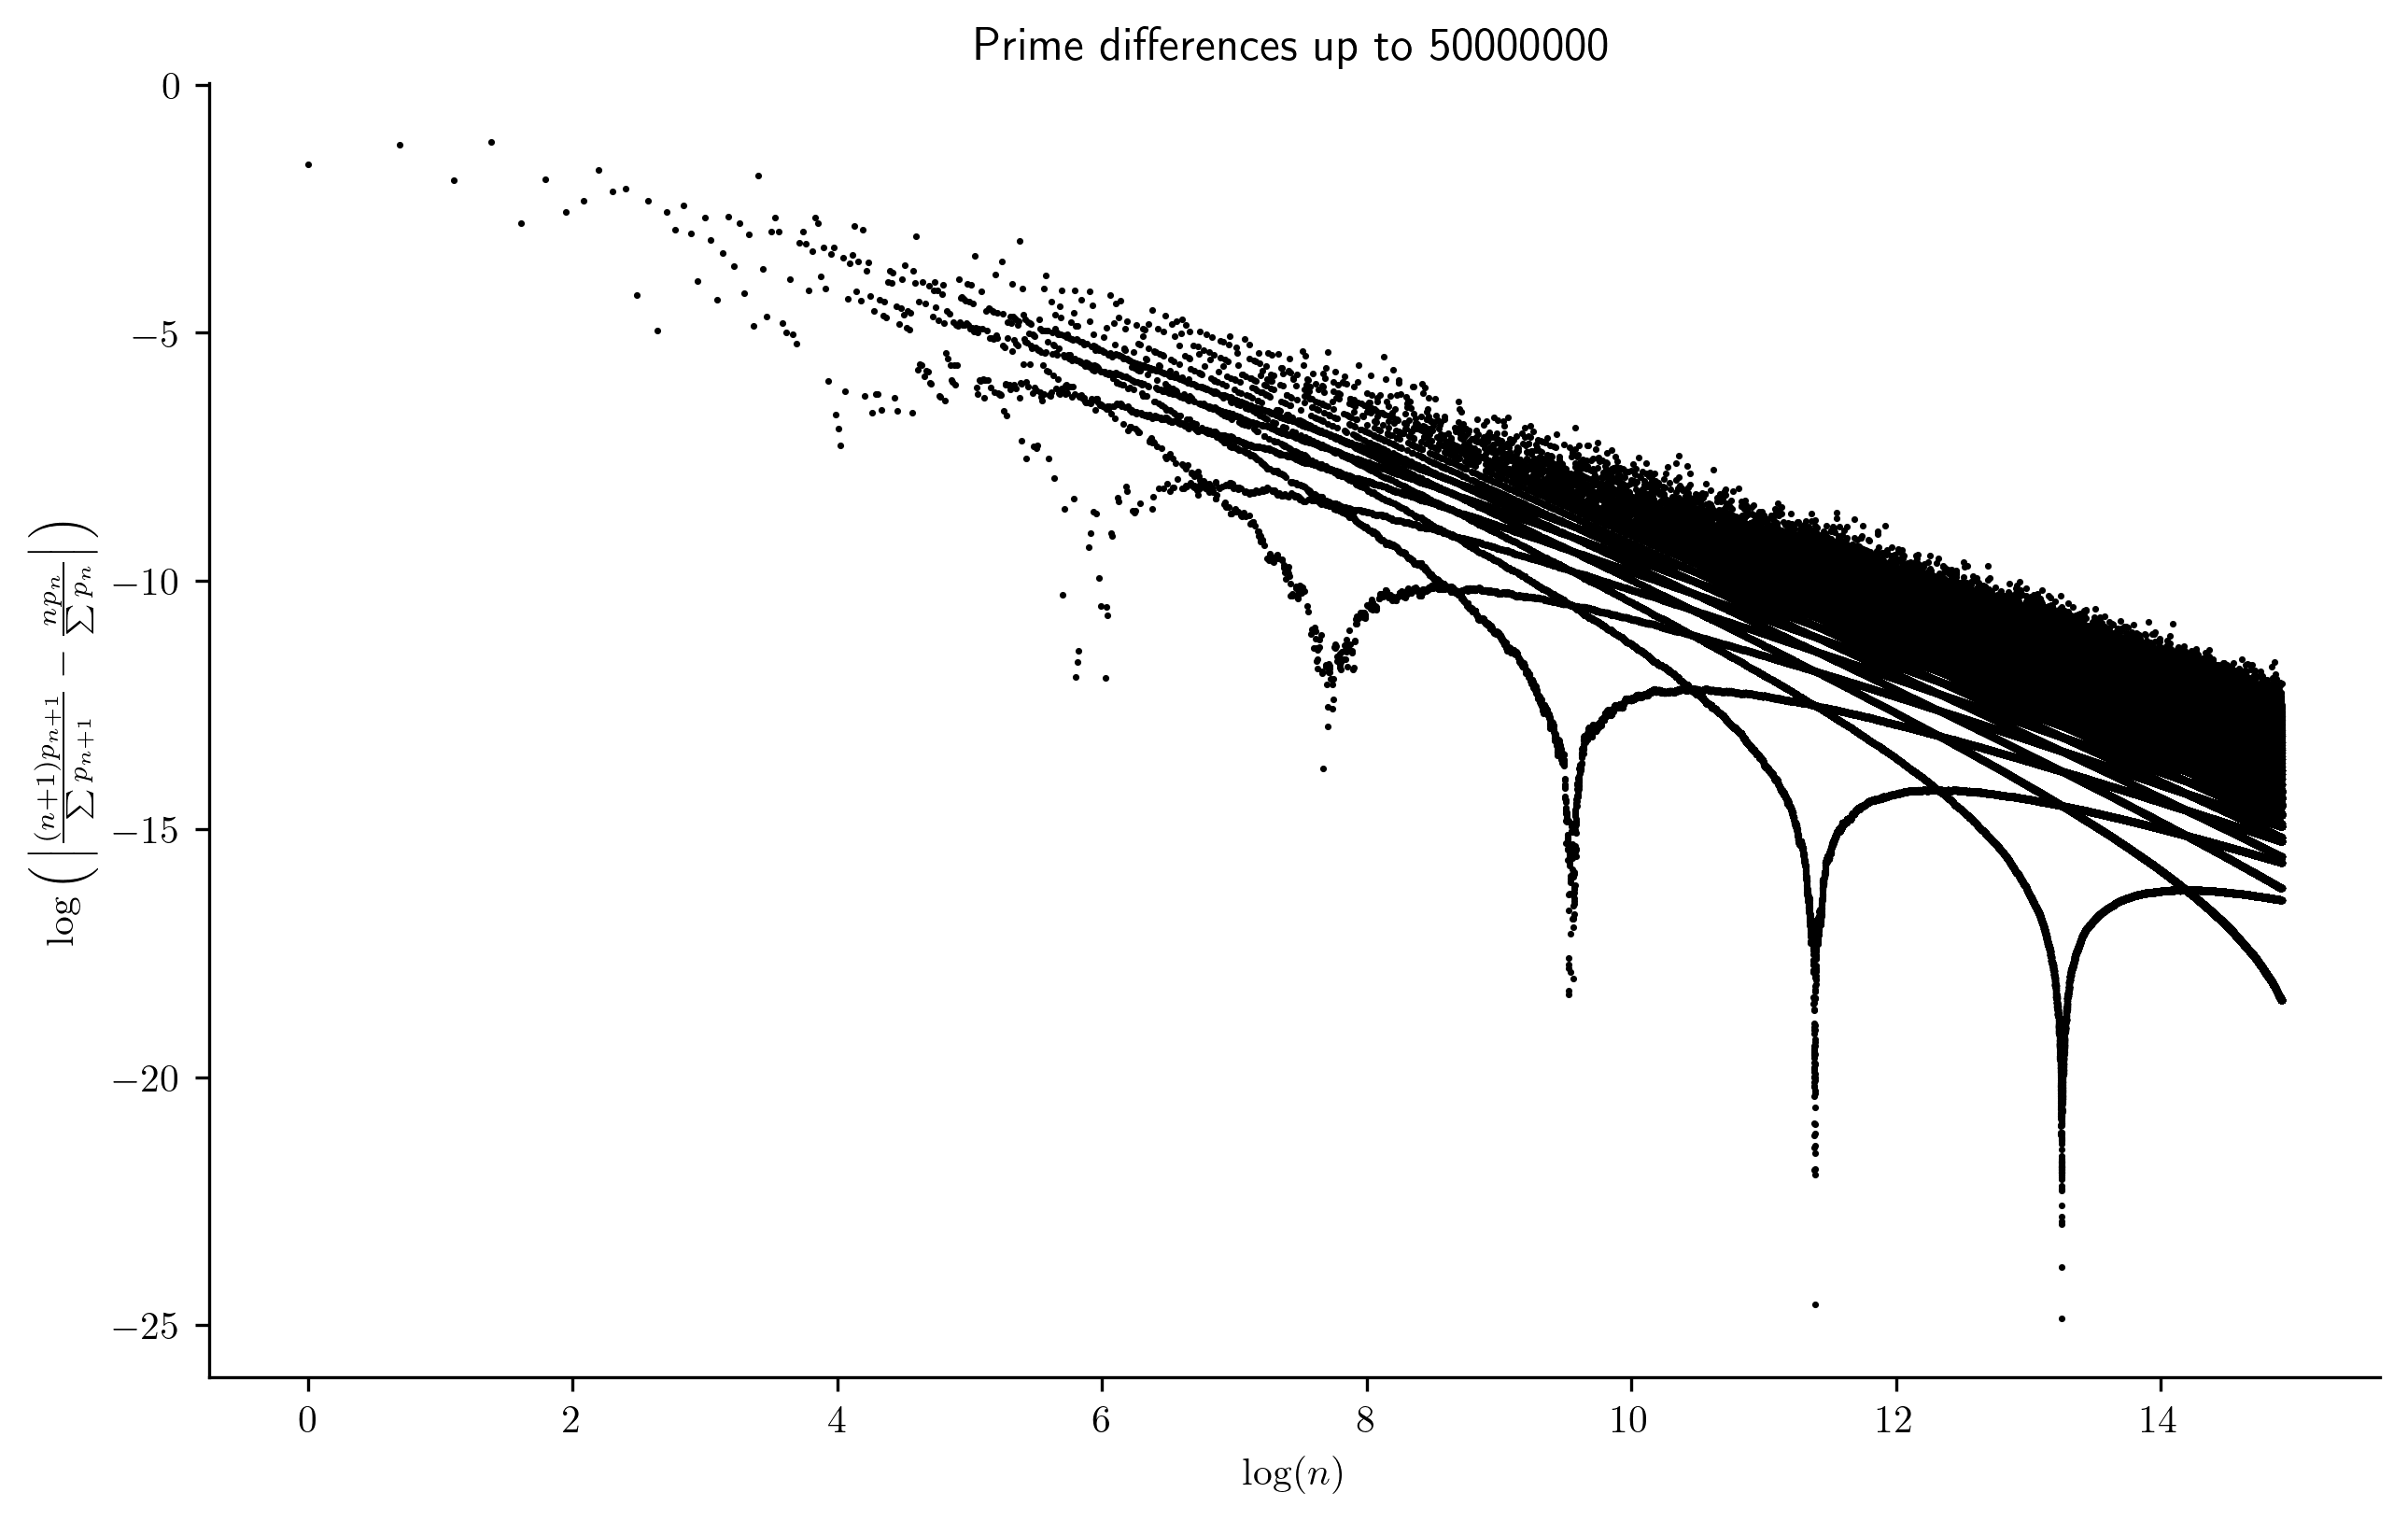
Fundamentally, this image depicts differences between sums related to primes. Let $p_n$ denote the $n$th prime. It follows from the Prime Number Theorem that $p_n \approx n \log n$, and thus that $n p_n \approx n^2 \log n$. One can also show that $$ \sum_{m \leq n} p_m \approx \frac{1}{2} n^2 \log n,$$ and thus we should have that $$ \frac{n p_n}{\sum_{m \leq n} p_m} \to 2.\tag{1}$$
The vertical axis in the image above examines differences between consecutive $n$ in $(1)$ (in log scale), while the horizontal axis gives $n$ (also in log scale).
The fact that $(1) \to 0$ corresponds to the overall downwards trend in the graph. But there is so much more structure! Why do the points fall into "troughs" or along "curtains"? Does each line mean something?
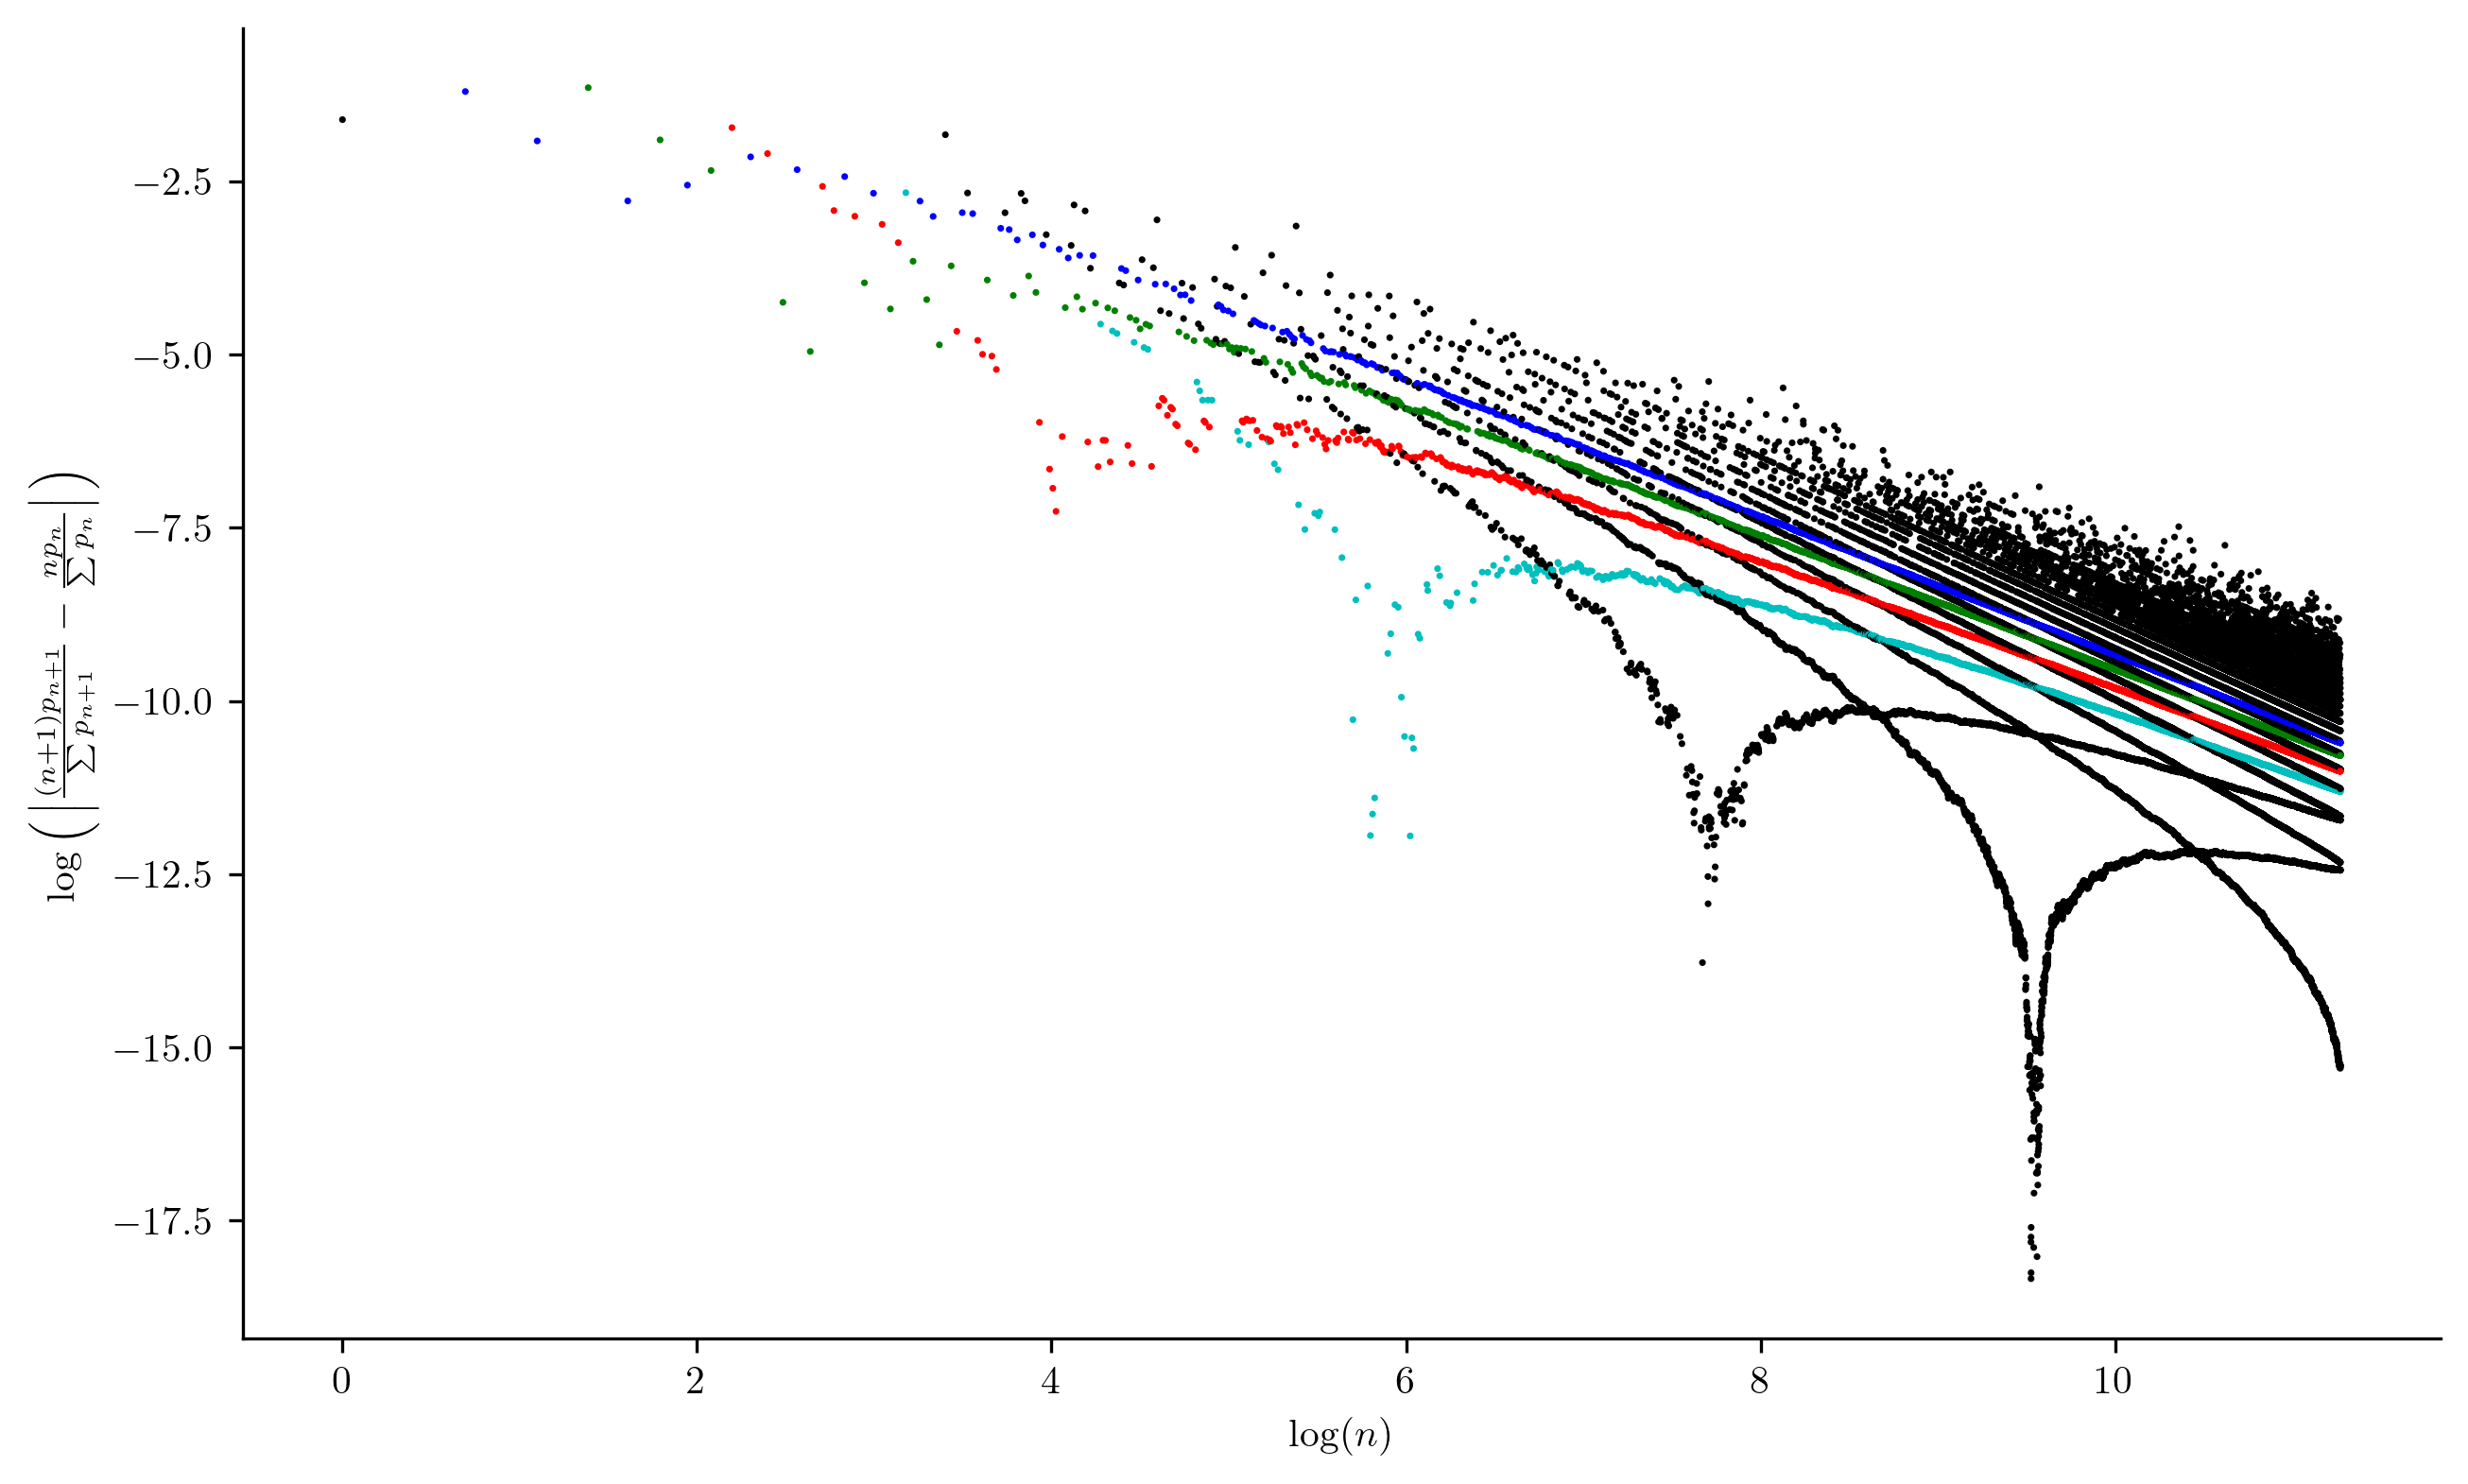
In this version, I've colored differences coming from when $p_n$ is a twin prime (in blue), a cousin prime (in green), a sexy prime (in red), or a prime $p$ such that the next prime is $p+8$ (in cyan). The first dot is black because it comes from $2$. The next two correspond to $3$ and $5$ (both twin primes), and the fourth dot corresponds to $7$ and is green because the next prime after $7$ is $11$, and so on.
This is a strong hint at distributional aspects alluded to within the plots.
Nir, Raymond, and Henry proved many things! They quantified the rate of convergence in $(1)$ and thus quantified the guaranteed downward trend in the images and found images that better convey the structure of what's going on better. I was already very impressed, but then they branched out and studied more!
Cramér's Model
We chose to investigate a nuanced question: what aspects of the initial plots depend strongly on the fact that the underlying data consists of primes, and what aspects depend only on the fact that the underlying data consists of integers with the same density as the primes?
To study this, one can create a new set of distinguished elements called Promys Primes (PPrimes) with the same density as true primes using probabilistic ideas of Cramér. Let's call $2$ and $3$ PPrimes, and then for each odd $m \geq 5$, we call $m$ a PPrime with probability $2 / \log m$. Do this for a large sequence of $m$, and we get a collection of PPrimes that has (with very high probability) the same density as true primes, but none of the multiplicative structure.
It turns out that for sets of PPrimes, there are analogous pictures and the asymptotics are even better! This is in section 3 of their write-up.
Gaussian Integers
We also thought to study analogous situations in related sets of primes, such as the Gaussian integers. Recall that the Gaussian integers $\mathbb{Z}[i] = \{ a + bi : a, b \in \mathbb{Z} \}$ are a unique factorization domain and have a rich theory of primes. Sometimes this theory is very similar to the standard theory of primes over $\mathbb{Z}$. But there are challenges.
One significant challenge is that $\mathbb{C}$ is not ordered. A related challenge is that there are more units. Over $\mathbb{Z}$, both $2$ and $-2$ are primes, but we typically recognize $2$ as being more "simple". For Gaussian primes, there isn't such a choice; for example each of $1 + i, 1 - i, -1 + i, -1 - i$ are Gaussian primes, but none are more simple or fundamental than the others.
More concretely, one has to be careful even with how to define the "sum of the first $n$ primes". One natural thought might be to sum all Gaussian primes $\pi$ that have norm up to $X$. But one can quickly see that this sum is $0$ for analogous reasons to why the sum of all the typical primes with absolute values up to $X$ must vanish ($p + -p = 0$). In the Gaussian case, it is also true that $$ \sum_{N(\pi) \leq X} \pi^2 = 0.$$
But they considered higher powers, where there aren't trivial or obvious reasons for massive cancellation, and they showed that there is always nontrivial cancellation. This is interesting on its own!
Then they also constructed a mixture, a Cramér-type model for Gaussian primes and showed that one should expect nontrivial cancellation there for purely distributional reasons.
I leave the details to their write-up. But they've done great work, and I look forward to seeing what they come up with in the future.
Info on how to comment
To make a comment, please send an email using the button below. Your email address won't be shared (unless you include it in the body of your comment). If you don't want your real name to be used next to your comment, please specify the name you would like to use. If you want your name to link to a particular url, include that as well.
bold, italics, and plain text are allowed in comments. A reasonable subset of markdown is supported, including lists, links, and fenced code blocks. In addition, math can be formatted using
$(inline math)$or$$(your display equation)$$.Please use plaintext email when commenting. See Plaintext Email and Comments on this site for more. Note also that comments are expected to be open, considerate, and respectful.