Inspired by conversations with Elias Wegert and Frank Farris at the Illustrating Mathematics semester program at ICERM last year, I wrote several plotting libraries for complex plotting. I wrote them with the intention of plotting modular forms in a variety of ways, leading to my talk at Bowdoin in November 2019 and my first post on the CS arxiv.1 1and when I learned that arxiv editors read papers close enough to reclassify them.
I've gotten several requests to make these plotting libraries available, and so I've made davidlowryduda/phase_mag_plot available on github as a sage library. See the github page and README for examples and up-to-date information.
This version is capable of producing contour-type plots of complex functions.

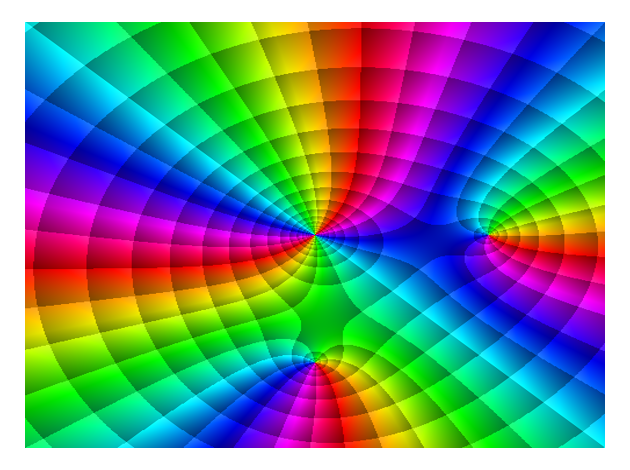
This does not include any colormap capability yet, as that is a substantially more involved2 2perhaps to be read as "hacky" in my current implementation process. But at some point in the future, I intend to look at revisiting the complex plotting within sage itself, perhaps updating it to allow plots of this nature.
Leave a comment
Info on how to comment
To make a comment, please send an email using the button below. Your email address won't be shared (unless you include it in the body of your comment). If you don't want your real name to be used next to your comment, please specify the name you would like to use. If you want your name to link to a particular url, include that as well.
bold, italics, and plain text are allowed in
comments. A reasonable subset of markdown is supported, including lists,
links, and fenced code blocks. In addition, math can be formatted using
$(inline math)$ or $$(your display equation)$$.
Please use plaintext email when commenting. See Plaintext Email and Comments on this site for more. Note also that comments are expected to be open, considerate, and respectful.
Comments (2)
2021-02-25 Jan van Delden
I took the liberty to download your SageMath module and changed a few options.
Since I was not completely clear on the interaction between lightness and color (defined by the argument of the function to be displayed) I decided to weigh these differently. Color, from the colorwheel by 0.8 and lightness by 0.2. I computed the color first and weighed later. Changed the modulus operation to argument-floor(argument) to solve a problem for arguments near 0. Added the option to choose the number of subdivisions which are used to stress particular moduli or phases.
I read both books, love them, and already implemented the extended phase portrait into Maple, c (including domain coloring in general) and Ultra Fractal. Since it was time to learn sage and had to learn how to program, I used your module as my first project. And as you stated: it is time to learn how to incorporate a module into sage, without having to load it. No idea yet, but onwards we go...
2021-02-25 davidlworyduda
I'm glad to hear it! I would also read issues or pull requests on github.
I think it would not be particularly hard to incorporate this into official sage. I have a local build of sage that includes a variant of phase_mag_plot as the default complex_plot. There are a few additional usability things I need to do before submitting this to the official sage.
I'd also like to write the general colormap functionality in a good way to be included too, but I haven't gotten around to that yet.
To learn more about contributing directly to sage (which is fun and exciting, and there are several great programmers who routinely contribute), check out https://doc.sagemath.org/html/en/developer/index.html.