I am happy to announce that an enhanced version of phasemagplot is now available, which I refer to as colormapplot. (See also the announcement post for phasemagplot).
This is available at davidlowryduda/phasemagplot on github as a sage library. See the github page and README for examples and description. The docstring from within sage should also be of use.
As a general rule, the interface is designed to mimic the complex plotting interface from sage as closely as possible. The primary difference here is that there is an optional cmap keyword argument. This can be given any matplotlib-compatible colormap, and the resulting image will be given with that colormap.
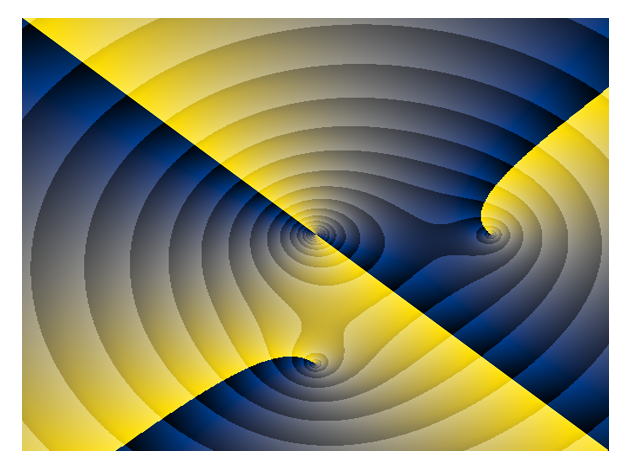
This is capable of producing colormapped, contoured images such as the following.
Leave a comment
Info on how to comment
To make a comment, please send an email using the button below. Your email address won't be shared (unless you include it in the body of your comment). If you don't want your real name to be used next to your comment, please specify the name you would like to use. If you want your name to link to a particular url, include that as well.
bold, italics, and plain text are allowed in
comments. A reasonable subset of markdown is supported, including lists,
links, and fenced code blocks. In addition, math can be formatted using
$(inline math)$ or $$(your display equation)$$.
Please use plaintext email when commenting. See Plaintext Email and Comments on this site for more. Note also that comments are expected to be open, considerate, and respectful.
Comments (2)
2022-03-27 Andrew
Some plots in SageMath, what do you think: https://sheerluck.github.io My first web site ever in my life :)
2022-04-20 davidlowryduda
I like that you made a custom colormap and went with it. I think this sort of experimentation will lead to powerful, informative visualizations.
Congratulations on making a website!