This is a post written towards my students in Calc II, Math 100 at Brown University, fall 2013. There will be many asides, written in italics. They are to serve as clarifications of method or true asides, to be digested or passed over.
The semester is over. All the grades are in and known, fall 2013 draws to a close. As you know, I'm interested in the statistics behind the course. I'd mentioned my previous analysis about the extremely high correlation between first midterm and final grade (much higher than I would have thought!). Let's reveal the statistics and distribution of this course.
Unlike last year, we'll be examining the data for the overall class (about 200 students). This is large enough that I feel the numbers might really mean something. Here is the distribution of the final grades in the class (final grades, not the grades on the final exam). The horizontal axis indicates final grade, and the vertical axis indicates the number of students receiving that grade.
[The grades are in clumps of 3 point ranges. So "60" really means from 60 to 63, and so on.]
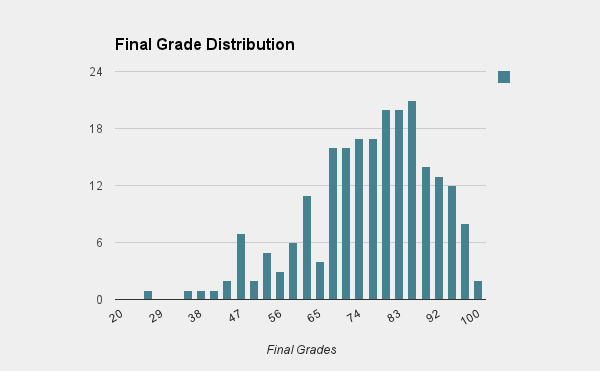 The highest overall grade was a 99.5%, which is an incredible grade. From the picture, you can see that the distribution is roughly normal (Gaussian), slightly skewed. Most people did pretty well. The overall mean was about a 75% with 14% standard deviation. The median was about a 78%. (My two sections were each a bit above the overall average, approximately 3 points higher. Discounting two outliers, which we had, it ends up being about 5 points higher. While nice, these are not statistically significant - one might assume this would happen purely by chance and completely independent of being in my section about 4 times out of 10).
Many times throughout the course, I estimated that an A would be a bit above half a standard deviation above mean, and passing would be roughly one standard deviation below mean, and the B/C line would be roughly in the middle, but harder to say. So the going heuristics going into the final were an A being somewhere between an 82 and an 85, a B being somewhere around 72, and passing to be somewhere around 60.
(Assuming a normal distribution, roughly 30% of the class should score half a standard deviation above mean. Roughly 25% should score above .7 standard deviations from the mean. Often between 25% and 30% of students receive an A in Math 100 (though this is not a requirement, nor something set down by the university), so that's why I'd expect the .5 to .7 standard deviations above mean. Similarly, roughly 15% of the class should score less than 1 standard deviation below the mean - though some of these students drop the course before the final, so you'd expect maybe 10% of the class who took the final exam to fail.
It is because I expect the class to fall roughly along a normal distribution that I give such heuristics in terms of standard deviations. This suggests that the class is graded on a curve, but in fact this is not the case! By this, I mean that the final grade decisions are based on other criteria, fundamentally different than standard deviations. By I stand by my standard deviations heuristics! By the way, these should work in most classes at Brown, not just this one. Better heuristics would become available to you after learning a little statistics).
In fact, an 85% ended up being the A cutoff, a 71% ended up being the B cutoff, and a 58% ended up being the C cutoff (approximately). I must admit that I'm pleased at how close these were to prediction. What this means is that roughly 25% of the class got an A, 40% of the class got a B, 25% of the class got a C, and 10% failed. (This was essentially the distribution of my two sections).
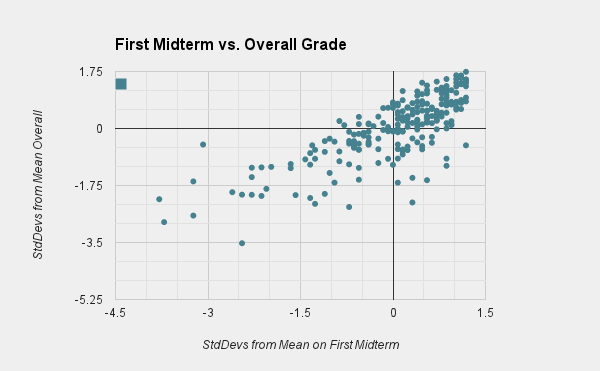
In this graphic, we see the standard deviations from the mean on the first midterm plotted against standard deviations from the mean overall. So a point with coordinate (-1, 1) would mean that a student scored one standard deviation below the mean on the first midterm and one standard deviation above the mean overall. There are several interesting things about this graphic.
Firstly, it's very linear with pretty strong correlation. If you're familiar with statistics, the correlation coefficient was 0.778, which is extremely high. This suggests that one can say a lot about a student's overall grade as early as the first midterm, which I find sort of surprising. In other words, those who start ahead stay ahead, and those who fall behind don't catch up, on average.
Secondly, notice the bottom right and upper left quadrants. Being in the bottom right means that you did well on the first midterm but poorly overall, while being in the top left means that you did poorly on the first midterm but well overall. There are many more students in the bottom right. No student who scored .5 standard deviations below the mean on the first midterm managed to get an A overall (and in general, those who are in the top left quadrant didn't get very high on the vertical axis). On the other hand, there were students who got almost a whole standard deviation above mean on the first midterm that nonetheless got a C in the class (and there were some who did just a little worse on the first midterm did much, much worse overall, as evidenced by the large vertical distances in the bottom right quadrant).
A suggestion to take to heart here is to not fall behind at the start - it's very painful and atypical for students to catch up afterwards. This might be because of the strong cumulative nature of mathematics, although I don't actually thing that's true of this course.
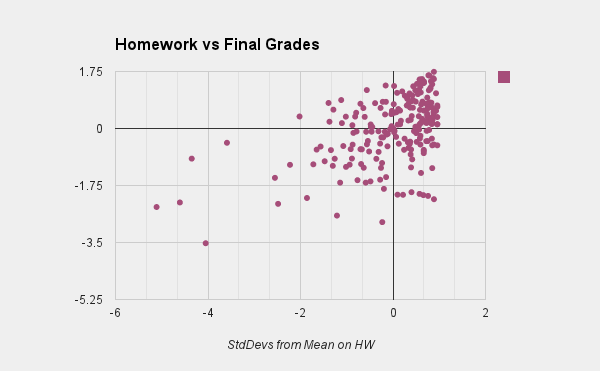
In contrast, this graphic displays standard deviations compared to mean of HW (horizontal) vs. final grade (vertical). This is a lousy correlation (the correlation coefficient is about .44, which is a very weak correlation). This doesn't surprise me, since
- Homework is done with references in an unrestricted amount of time.
- Many students work together on homework. While this can be good, it also leads to students who insufficient amounts of work and rely on friends to get by. While it can be easy to brush this aside and say I'll figure it out before the test, a recurring theme from this post is to not fall behind. Within this category should also be those students who come to rely on tutoring services for homework completion as opposed to subject mastery - which I've certainly seen before (even as a tutor).
- Some students straight up cheat, by using WolframAlpha (which can do most of your homework for you at the level), or even by using the solutions manual (which some students have acquired).
What does surprise me is the number of students who did badly on homework and yet well overall (almost 8% of the class). This does sort of surprise me. I've come to expect that doing well on homework does not mean that a student does well overall in the class, but doing poorly on homework does mean a student will do poorly overall - sort of a discipline thing. And while this was true on average here, 8% of the class managed to surprise me.
Although I don't put the graphs here, I should note other poor indicators. Recitation attendance provided no meaningful information since essentially every student showed up to essentially every recitation. Those who missed more than 3 recitations did significantly worse than those who missed at most 2, but this is more likely evidence of differently-placed priorities than anything absorbed during recitation. Quiz grades had a weak positive correlation with final grades. More interestingly, each student's quiz grade stayed largely constant throughout the semester - likely indicating how much pre-studying each student would do prior to each recitation.
All in all, I would distill two messages from these statistics. Firstly, don't fall behind at the beginning, since performance roughly 1 month in is a great predictor of overall performance - each semester, there are students who convince themselves they'll catch up before the final, but they don't on average (or often at all).
Secondly, even though Brown classes may not be graded on curves/by distribution (like this one), normal distributions allow for extremely accurate predictions of student grades, i.e. it is almost as if you were, in fact, graded on a bell curve.
I won't be posting the final or its solution to this site by external request (they don't want to establish a question bank... although this does not prevent some enterprising students from setting up a student-run repository, which would be relatively easy to do), though you can schedule a time with your lecturer to see the final, its solution, and/or your grade at your leisure.
As usual, if you have questions, feel free to let me know. Other than that, have a happy new year, and may you stumble across something that interests you all.
Info on how to comment
To make a comment, please send an email using the button below. Your email address won't be shared (unless you include it in the body of your comment). If you don't want your real name to be used next to your comment, please specify the name you would like to use. If you want your name to link to a particular url, include that as well.
bold, italics, and plain text are allowed in comments. A reasonable subset of markdown is supported, including lists, links, and fenced code blocks. In addition, math can be formatted using
$(inline math)$or$$(your display equation)$$.Please use plaintext email when commenting. See Plaintext Email and Comments on this site for more. Note also that comments are expected to be open, considerate, and respectful.